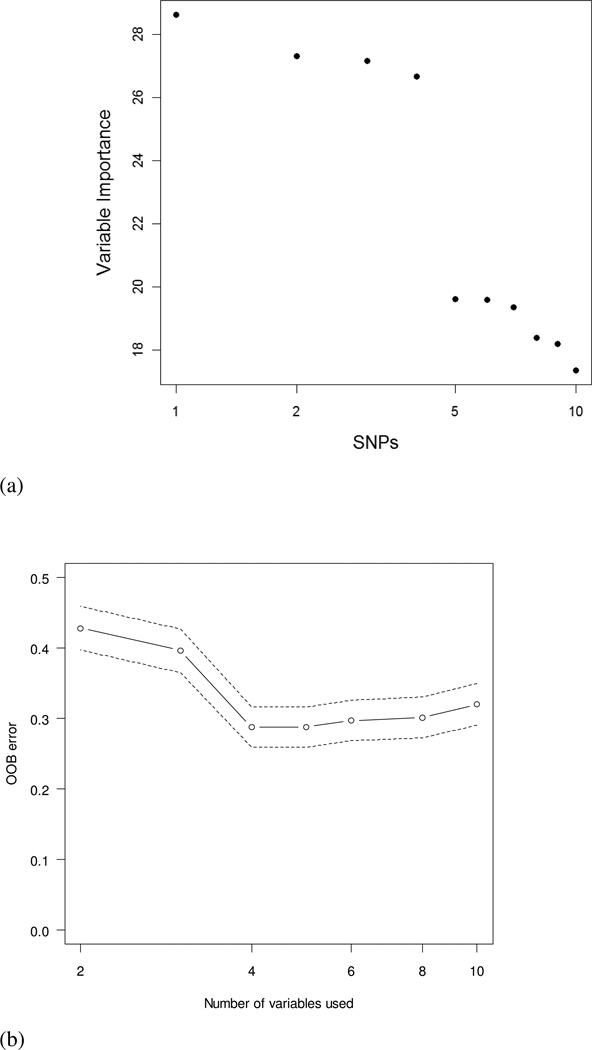
Figure 3.
(a) Variable importance plot on all SNPs. The importance values for all SNPs were calculated to assess the relevance of each variable over all trees of the ensemble. The plot showed the first four variables were more valuable than the other SNPs because the first four had the higher importance values; (b) A plot of out-of-bag error rates against the number of variables used. The plot showed that the four variable models had the smallest error rate.

