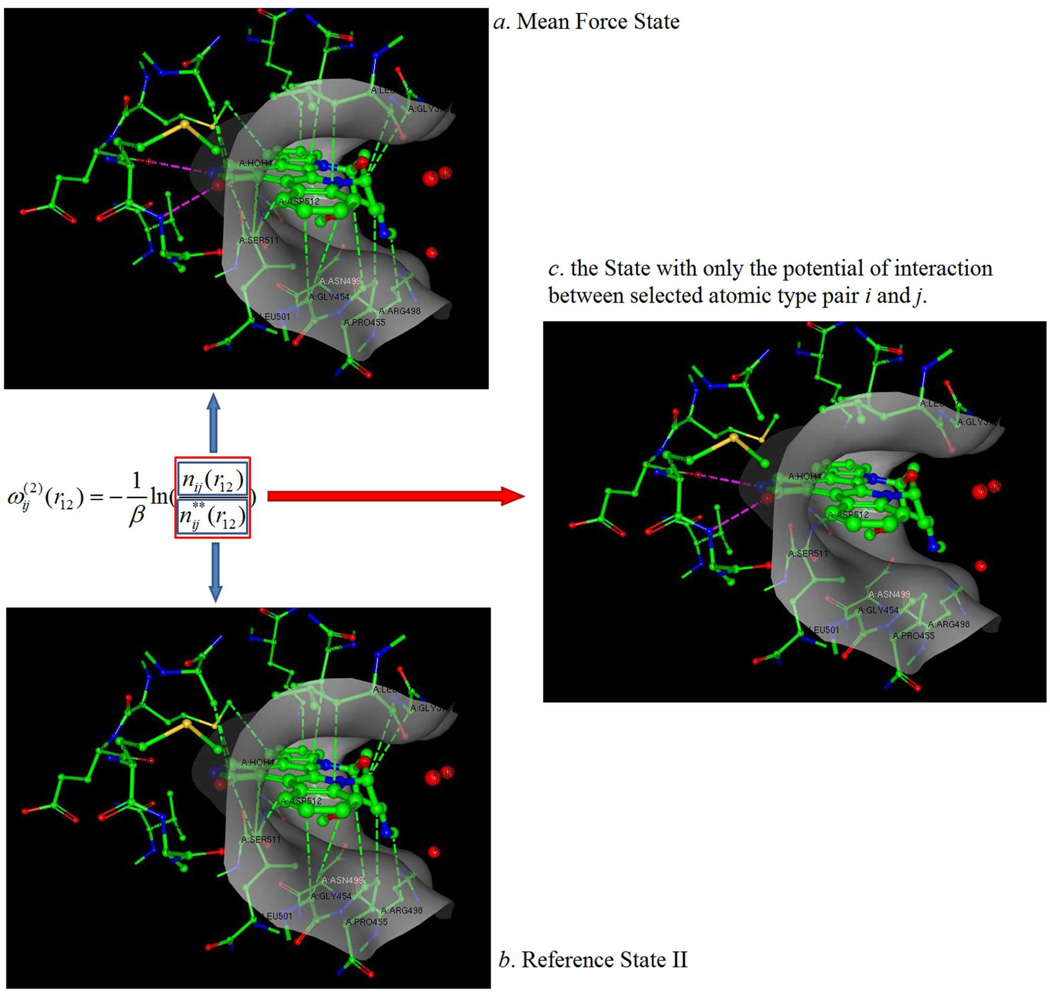
Figure 1.
A protein-ligand structural illustration (using PDBID 1xbc) of how the KECSA statistical potential is modeled. The protein binding site is shown as a grey surface with the ligand located within the binding site surrounded by protein residues which it makes contacts with. The pink dashed lines indicate interactions between certain atom pair types i and j, (i.e. carbonyl oxygen with amine nitrogens in this example) which are defined as "selected interactions" in this manuscript. Green dashed lines indicate all other non-covalent interactions between the protein and ligand atoms in the binding pocket, defined as "background interactions". (a) In the mean force state, the system is filled with all types of interactions. (b) The reference state II contains all the background interactions. (c) Removing all the background interactions from total interactions results in a state with only the selected interactions for each i and j combination.

