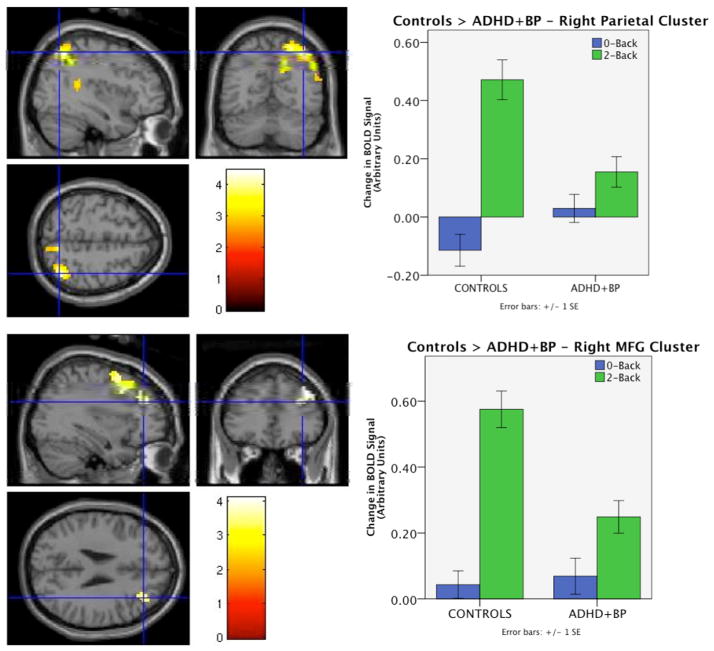
Figure 1. Main effect of diagnosis in 2-Back > 0-Back contrast.
Left panels show statistical t-maps displaying clusters significantly more active in healthy controls than ADHD+BPD including right lateral parietal lobe (top: peak voxel = [39 −63 54], K=706, corrected p-value < 0.0001) and right lateral prefrontal cortex (bottom: peak voxel = [30 12 42], K=351, corrected p-value = 0.002). Right panels show magnitude of BOLD signal change in each condition in each task compared to fixation baseline for the mean activation over the significant parietal (top) and frontal clusters (bottom). No brain regions were significantly more active the comorbid vs. control group.

