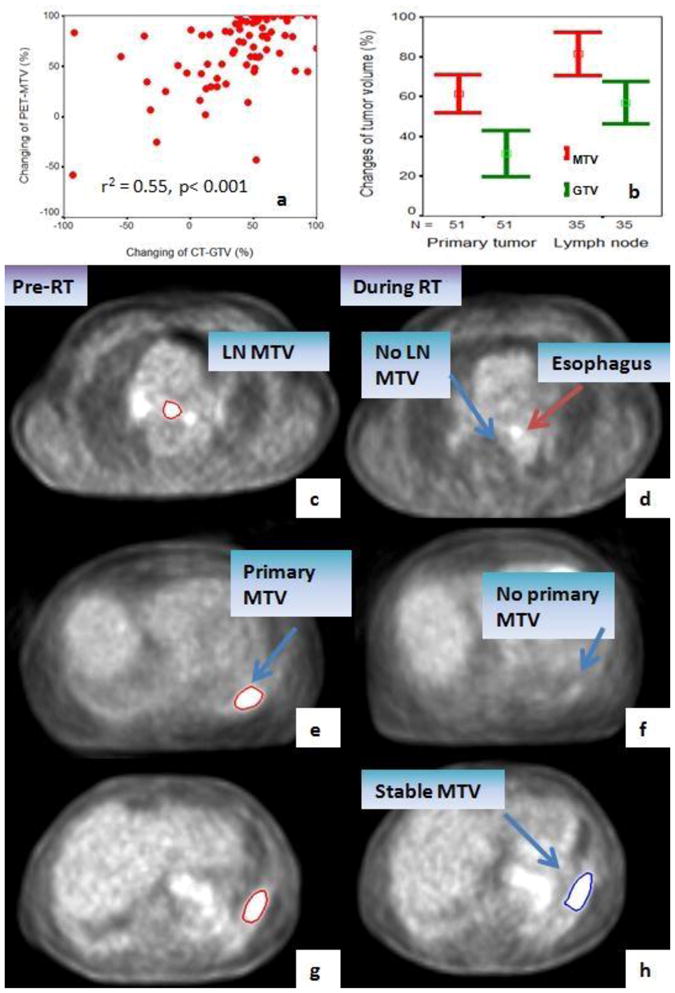
Figure 6.

Factors associated with PET-MTV changes during-RT. PET-MTV reduction is significantly correlated with the reduction in CT-GTV (a). Lymph nodes have a significantly greater reduction in both PET-MTVs and CT-GTVs during-RT (b). Examples scans include: Metabolic complete response (CR) in lymph node MTV (c and d). Metabolic complete response in primary tumor after concurrent chemo-RT (e and f). Metabolic stable response in SBRT case (g and h). GTV=gross tumor volume, MTV=Metabolic tumor volume.
