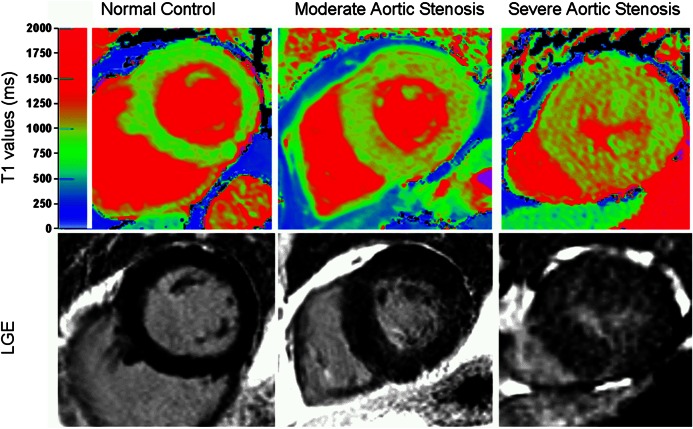
Figure 1.
Top panel: colour maps of T1 values using shortened modified Look–Locker inversion in a mid-ventricular short-axis slice; bottom panel: the corresponding slice with late gadolinium enhancement (LGE) imaging. The left-hand panel shows a normal volunteer (T1=944 ms). The middle panels show moderate aortic stenosis (AS) with moderate left ventricular hypertrophy (T1=951 ms). The right-hand panel shows severe AS with severe left ventricular hypertrophy (T1=1020 ms).

