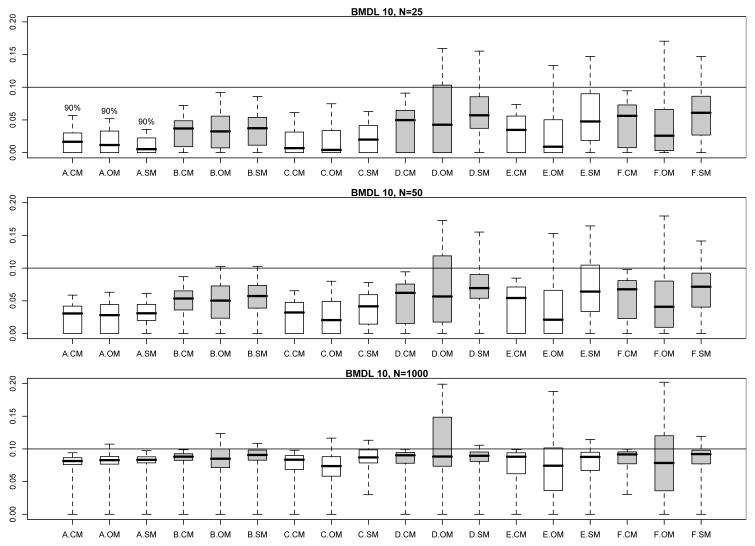
Fig. 1.
Modified boxplots of the true extra risk at calculated 95% BMDLs from the simulation results in §3; BMR = 0.10. (See text for details of the modifications.) Results are pooled across all eight models from Table I. Three boxplots are displayed for each parameter configuration, A–F, from Table II. A ‘.CM’ suffix corresponds to BMDLs calculated under the correct dose-response model in Table I. A ‘.OM’ suffix corresponds to BMDLs incorrectly calculated under the other models in Table I. A ‘.SM’ suffix corresponds to BMDLs calculated under the model actively selected from minimizing the AIC. The upper comparison graphic presents results for a per-dose sample size of N = 25, the middle graphic for a per-dose sample size of N = 50, and the lower graphic for a per-dose sample size of N = 1000. Shadings separate different configurations.

