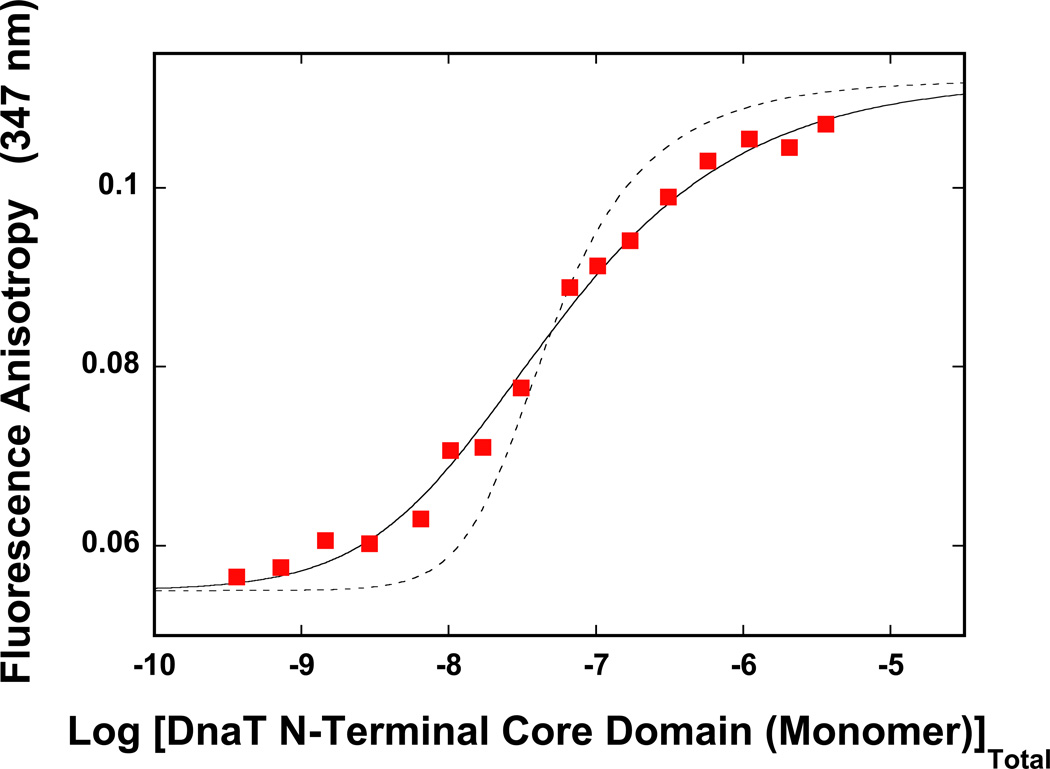
Figure 5.
The dependence of the DnaT N-terminal core domain fluorescence anisotropy upon the total domain monomer concentration (λex = 296 nm, λem = 347 nm) in buffer C (pH 7.0, 20°C) (Materials and Methods). The solid line is the nonlinear least-squares fit of the titration curve, using the dimer model described by eqs. 16 – 20, with KD = 2.1 × 10⁷ M−1, rM = 0.055, and rT = 0.112. The dashed line is the best fit of the titration curve using monomer <-> trimer model described by eqs. 3 – 7, with KT = 2.5 × 10¹⁴ M−2, rM = 0.055, rD = 0.112.

