
Figure 5.
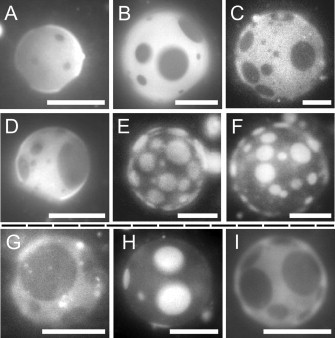
The fraction of membrane area covered by Lo (dark) phase strongly correlates with changes in the ratio of PG/PC lipids. Representative fluorescence micrographs are shown for GUVs composed of DiPhyPG-DPPC-Chol. Panels A–F are at T = 20°C with 20 mol % cholesterol, and molar percentages of DiPhyPG and DPPC of A: 60/20, B: 50/30, C: 40/40, D: 30/50, E: 20/60, F: 10/70. The area fraction of Lo phase increases dramatically from panel A to F. Panels G–I are at T = 25°C with 1:1 DiPhyPC/DPPC and mol % cholesterol of G: 20%, H: 40%, I: 60%. Panels G to I do not show a monotonic change in the Lo area fraction. All scale bars are 20 μm.