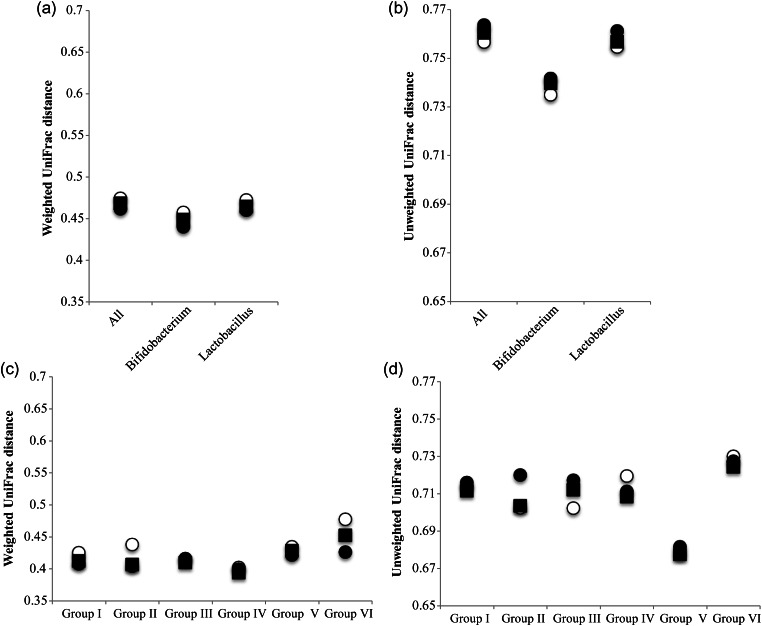
Figure 3.
Average UniFrac distance within Pro (−) and Pro(+) and between Pro(−) and Pro(+) for each group, type of probitotics, and all subjects. Average UniFrac distance between any pair of the three distances for type of probiotics and all subjects (a and b), and each group (c and d). Open circle, closed circle, and closed square indicate average UniFrac distance within Pro (−), within Pro (+), and between Pro(−) and Pro(+) samples, respectively.

