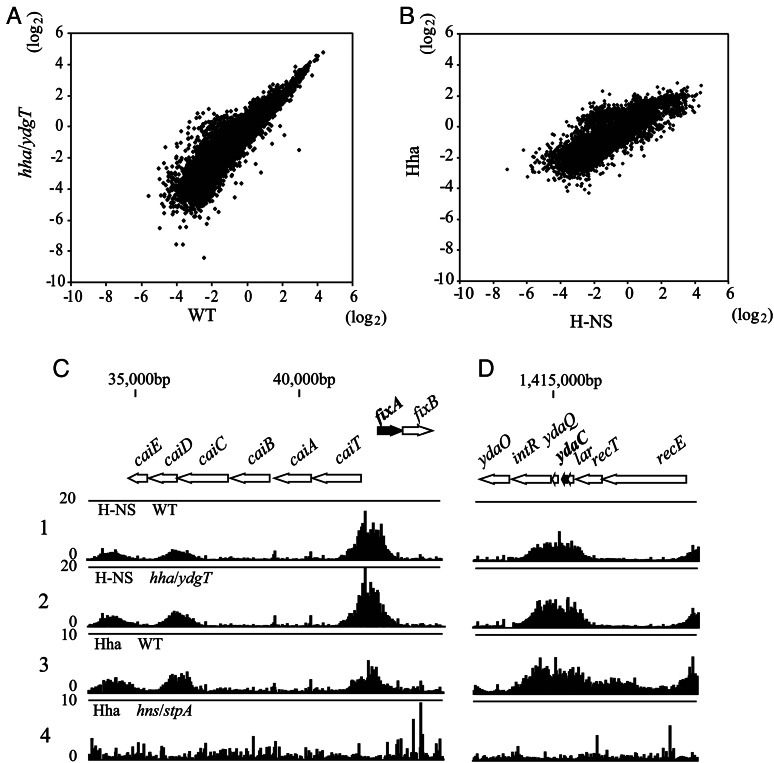
Figure 2.
Impact of hha/ydgT double inactivation on H-NS bindings and the genome-wide correlation of H-NS and Hha bindings. (A and B) Log scatter plots (log2) of the average signal intensities of H-NS binding signals from two independent experiments using wild-type (W3110) and hha/ydgT mutant cells (A), and H-NS binding signals in wild-type (W3110) cells and Hha binding signals in W3110 pQEHha cells (B). (C and D) Typical examples of H-NS-binding profiles in W3110 (lane 1) and W3110 hha::Km ydgT::Cm (lane 2), and Hha-binding profiles in W3110 pQE80Hha (lane 3) and W3110 hns::Km stpA::Cm pQE80Hha (lane 4) are shown with the binding signal of each probe mapped to the corresponding position in the E. coli chromosome. The binding intensity (vertical axis) was determined as the relative ratio of the signal intensity for the hybridization of labelled DNA fragments prepared from the ChIP (ChAP) versus Sup fractions in each experiment. The Hha binding signals were low throughout the genome of hns/stpA mutant cells (lane 4), and the background spike signals were enhanced when we conferred a signal average of 500 during signal intensity normalization prior to calculating the binding intensity. Shown are the H-NS and Hha binding profiles in the vicinity of a gene (fixA; black thick arrow) that was up-regulated only in hns/stpA mutant cells (C), or the H-NS- and Hha-binding profiles in the vicinity to a gene (ydaC) that was up-regulated in both hns/stpA and hha/ydgT mutant cells (D).

