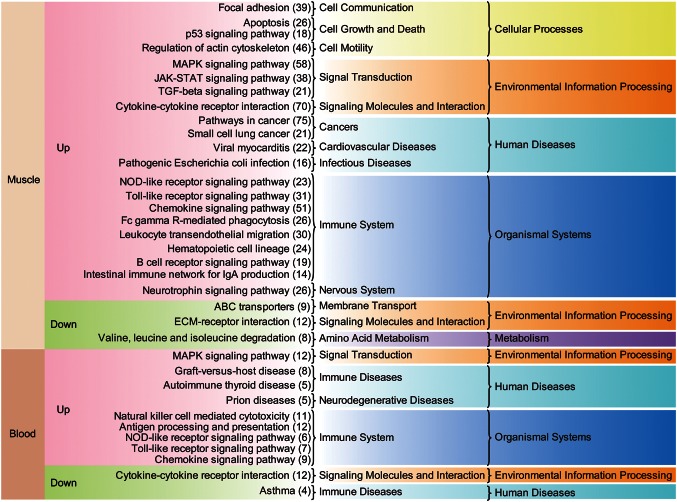
Figure 2.
Enriched KEGG pathways associated with DEGs in skeletal muscle tissue and blood. For each set of up-regulated and down-regulated DEG in skeletal muscle and blood, a KEGG pathway enrichment analysis was performed. Starting from the left, the figure shows: tissue type, status of regulation AE, KEGG pathway terms, higher-level KEGG pathway terms, and the highest level of KEGG pathway terms. The number of genes associated with the KEGG pathway is given in brackets on the right.

