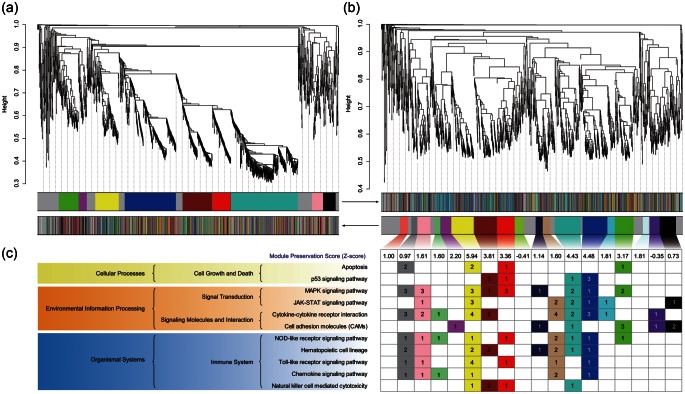
Figure 3.
Dendrogram of the weighted gene co-expression network, the network modules BE (a) and AE (b) in URGs of skeletal muscle and enriched KEGG pathways of module genes (c). The genes are clustered on a TOM, based on dissimilarity, and are presented as a dendrogram. Where genes have a high connectivity, they are clustered in the same module. The upper modules are based on the gene network formed BE, and the lower modules are based on that formed AE. The grey module contains uncharacterized genes. The preservation score of the condition ‘BE’ is shown in the box at the bottom of the modules. For each module, the number of the genes included in the enriched KEGG pathway is listed in the box.

