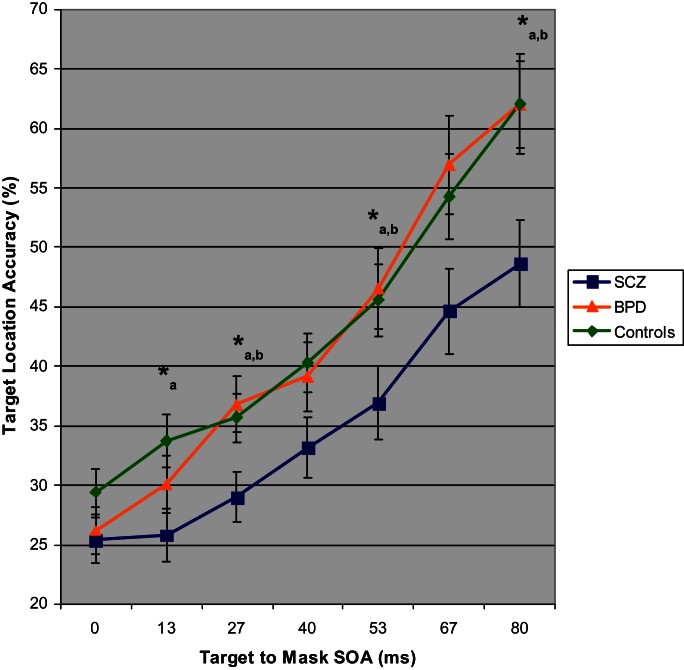
Fig. 1.
Target location mean accuracy with SEs for schizophrenia, bipolar disorder, and nonpsychiatric control participants as a function of stimulus onset asynchrony (SOA) between target and visual mask. Three-group ANOVA for each SOA: *P < .05. Follow-up paired comparisons with P < .05: a = schizophrenia group lower accuracy than control group and b = schizophrenia group lower accuracy than bipolar disorder group.

