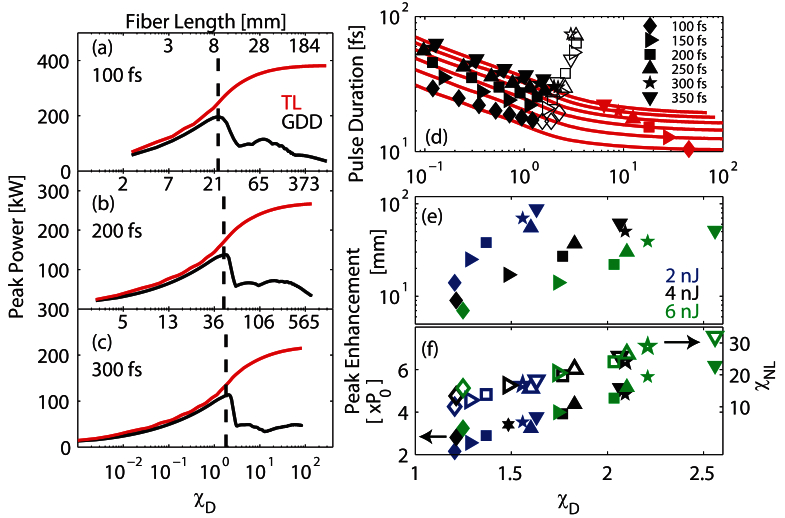
Fig. 2.
The peak power evolution with χD for 4 nJ 100 fs (a), 200 fs (b), and 300 fs (c) seed pulses and GDD compensation in black and complete compensation to the transform limit in red. The onset of WB is plotted in (a)–(c) as a dashed vertical line. (d) The transform limited pulse duration in red and the pulse duration with only GDD compensation in black markers as functions of χD for 4 nJ pulses and a suite of seed pulse durations: 100 – 350 fs. The solid black markers indicate the evolution up to the maximum peak power enhancement with GDD compensation, followed by hollow markers for additional propagation. The fiber length corresponding to the maximum peak power enhancement with GDD compensation as a function of χD (e) for a suite of seed pulses: 2, 4, and 6 nJ shown in blue, black, and green respectively, and pulse durations from 100–350 fs. The maximum peak power enhancement factor with GDD compensation, relative to the incident seed pulses (composed of twice the energy), and the accumulated nonlinear length at peak enhancement(f).

