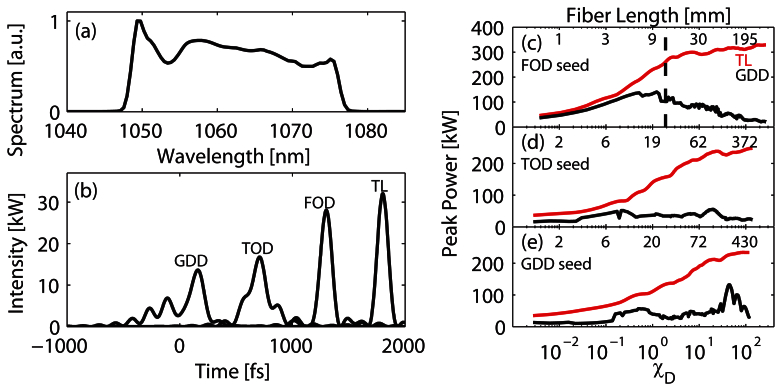
Fig. 7.
The power spectrum (a) and intensity, labeled GDD, (b) of the ANDi seed pulse reconstructed with SHG-FROG. Also in (b) are ANDi pulse intensities with up to TOD and FOD spectral phase compensation along with the transform limit. The peak power evolution with χD of SC with GDD compensation (black) and the transform limited SC (red) for some of the ANDi seed pulses in (b): FOD (c), TOD (d), and GDD (e). The onset of WB is plotted in (c) as a dashed vertical line.

