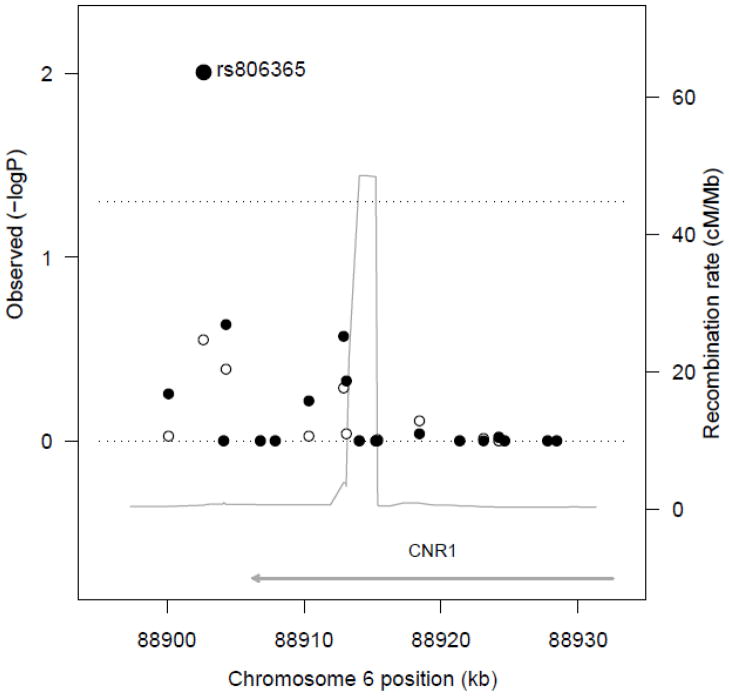
Figure 2.
Association among the CNR1 SNPs with HOMA-IR. The observed negative logarithm base 10 of the empirical P values for the association of CNR1 SNPs with HOMA-IR, without (white circles) and with BMI-adjustment (black circles) are plotted against genomic location. The recombination rate across the locus is shown by the thin grey line. The upper transverse dashed line represents an empirical P value = 0.05.

