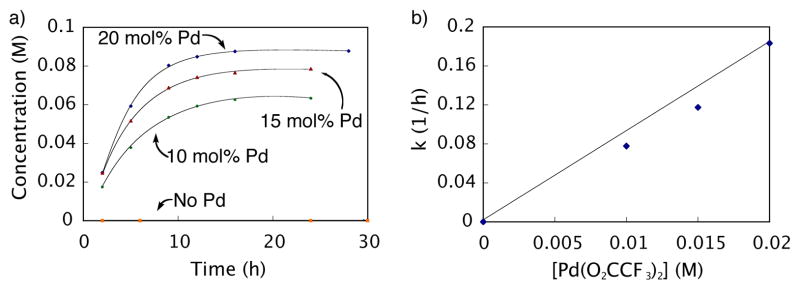
Figure 10.

Effect of catalyst loading on the decarboxylation of 6 as monitored by GC: ◆ = 20 mol% Pd(O2CCF3)2, ▲ = 15 mol% Pd(O2CCF3)2, ● = 10 mol% Pd(O2CCF3)2, and ■ = No Pd(O2CCF3)2. Reaction conditions: initial concentration [6] = 0.10 M and [Pd(O2CCF3)2] = 0.020, 0.015, and 0.010 M respectively, CF3CO2H (10 equiv), 3.0 mL 5% DMSO-DMF, 70 °C. a) Reaction run at 4 different palladium concentrations. b) Rate vs. [Pd(O2CCF3)2]. Equation of the line is y = 8.928x – 0.005. R2 = 0.986.
