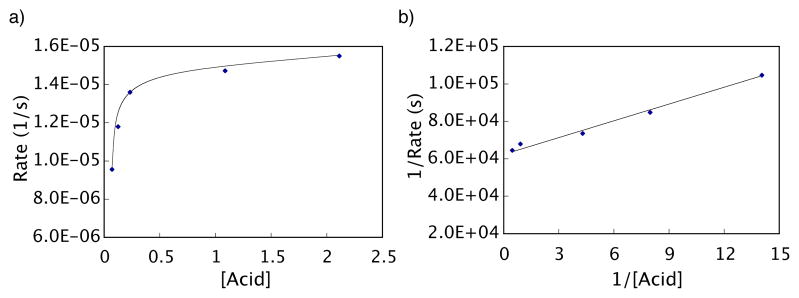
Figure 9.

Acid concentration effect on the decarboxylation of 6 as monitored by GC. Reaction Conditions: [6] = 0.11 M, [Pd(O2CCF3)2] = 0.016 M, CF3CO2H a) Reaction at 5 different acid concentrations (4.3, 7.7, 14.3, 67.7, and 134.3 equivalents with respect to palladium). b) Lineweaver-Burk plot70 (double reciprocal plot) confirming saturation kinetics. Equation of the line is y = 2861.6x + 63192. R2 = 0.986.
