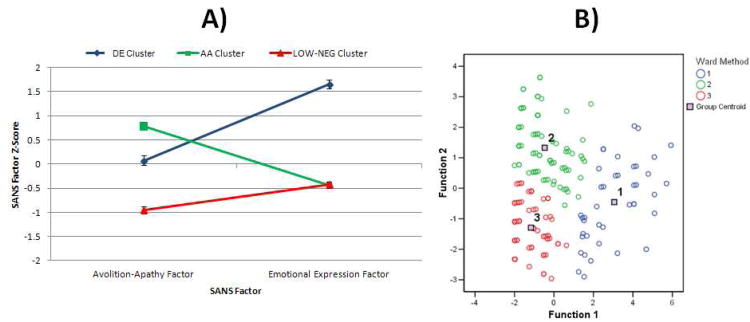
Figure 1. Means and SEs for SANS Factor Scores in AA, DE, and LOW-NEG Clusters (Panel A) and Three-Cluster Solution Plotted in Discriminant Function Space (Panel B) for Study 1.
Note. Panel A: Values represent Means and SEs for Z-scores of standardized factor scores calculated for each subject. Higher values represent greater symptom severity. Panel B: Cluster 1 = Diminished Expression; Cluster 2 = Avolition-Apathy; Cluster 3 = Low Negative Symptoms.

