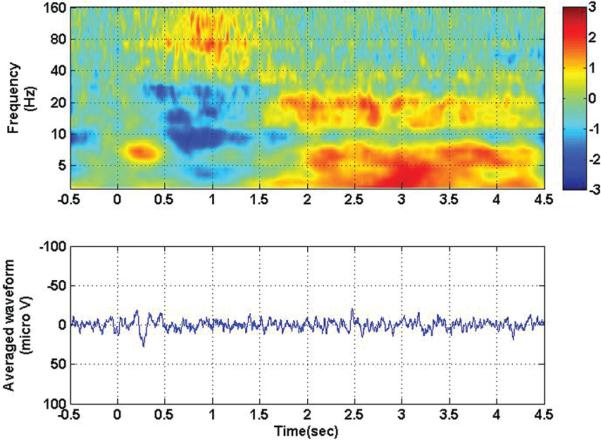
Fig. 4.
Time-frequency analysis (upper) and averaged evoked potential (lower) for contact 105, with all ipsilateral movement conditions collapsed together. Zero corresponds to visual stimulus onset. Note the persistence of the visual evoked potential, even in the hemisphere ipsilateral to movement. Note also the persistence of the high-frequency/low-frequency inversion associated with movement.

