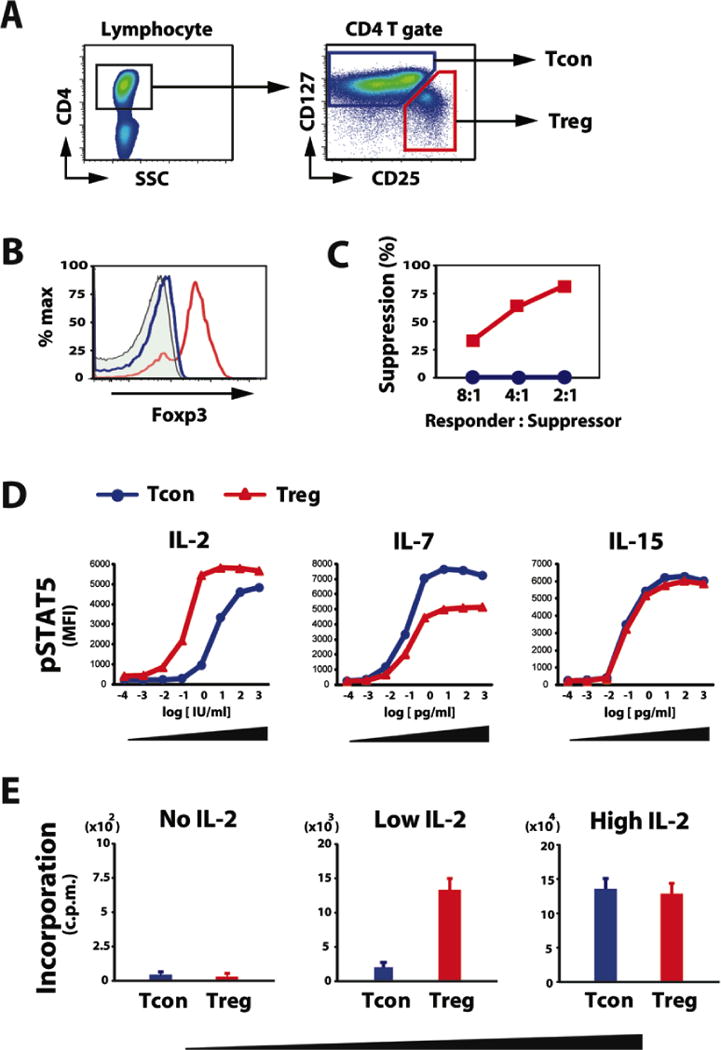
Figure 1. Phenotypic and functional characterization of human Treg and Tcon after in vitro cytokine activation.

(A) Representative lymphocyte gate for identification of CD4 T cell subsets. Within the CD4 T cell gate, Treg are identified as CD25med-highCD127low and Tcon are identified as CD25neg-lowCD127med-high. (B) Gated CD4 T cell subsets were examined for intracellular Foxp3 expression. Representative data is shown. Closed histogram represents isotype control. Blue and red histograms depict Tcon and Treg, respectively. (C) Tregor Tcon isolated from peripheral blood were cultured with responder Tcon from the same donor and stimulated with irradiated allogeneic PBMCs for 5 days. Method for calculating percentage suppression of proliferation is described in Methods. Data are representative of 5 independent experiments. (D) Purified Treg and Tcon were cultured for 15 minutes in various concentrations of IL-2, IL-7 and IL-15. The level of intracellular Stat5 phosphorylation (pStat5) was determined by flow cytometry. Cytokine dose-dependent phosphorylation of Stat5 in each CD4 T cell subset is shown. Data are representative of 3 independent experiments. (E) Purified Treg and Tcon were cultured in low (10 IU/ml) or high (100 IU/ml) concentrations of IL-2 for 5 days and cell proliferation was measured by thymidine incorporation. Data are representative of 3 independent experiments.
