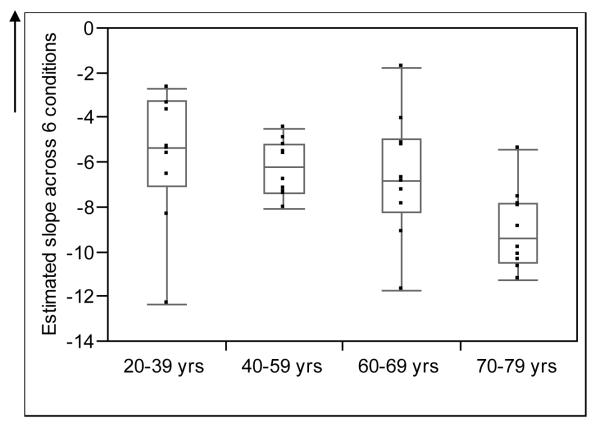
Figure 2.
Box plots showing the distribution of estimated slope across 6 conditions for the four age groups. The line in the middle of the box represents the median, while the ends of the box represent the 25th and 75th percentiles. The lines extending from the box represent the minimum and maximum observed values.

