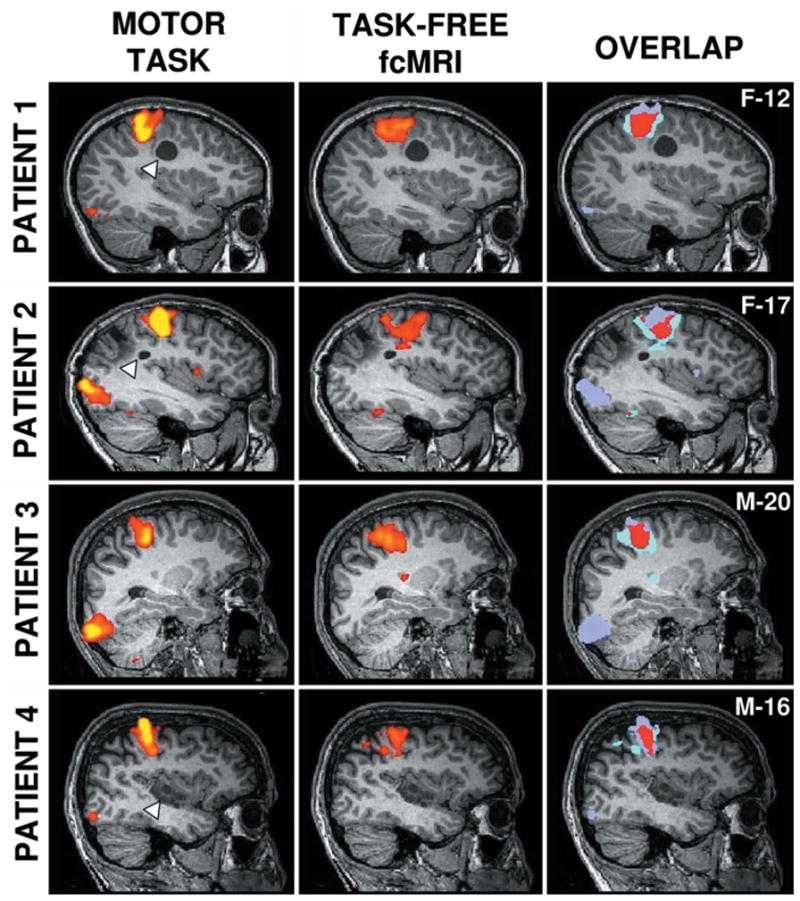
Fig. 1.

Task and fcMR imaging–based mapping localizing similar regions. Hand motor regions defined by actual motor task movements (left column) and task-free fcMR imaging (center column) are plotted on sagittal sections for each patient (overlaid on their structural image). Colors represent Z values, with the threshold set to Z = 0.4–0.5. The overlap of the two techniques is shown in red (right column). Each row displays a different patient, with the sex (M or F) and age (in years) indicated in the rightmost panel. Brain lesions are indicated by the white triangles for the patients in Cases 1, 2, and 4; the patient in Case 3 has no visible lesion.
