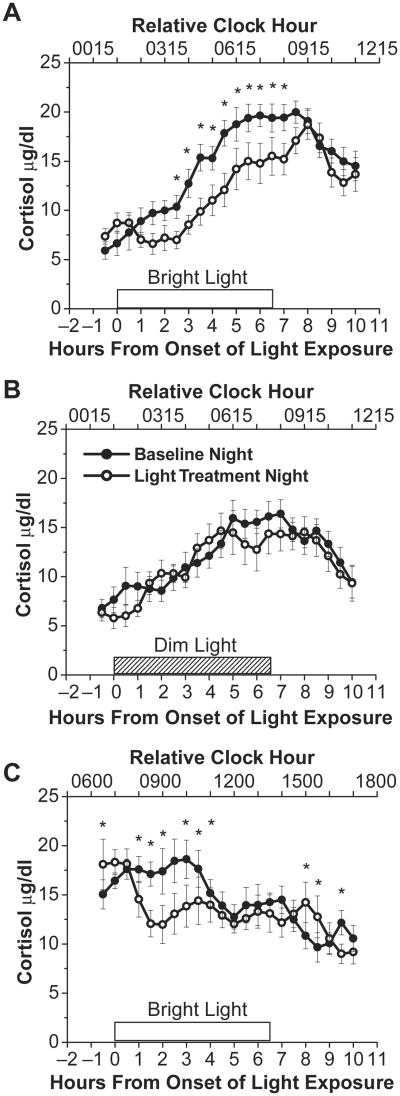
Figure 2.
Bright light and dim light exposure group curves. Panels A and B show cortisol levels on the rising phase of the cortisol rhythm during the baseline night (∼3 lux; closed circles) and immediately before, during, and after bright (∼10,000 lux; n = 8; open circles) or dim (∼3 lux; n = 7; open circles) light exposure, respectively. Panel C shows cortisol levels on the descending (n = 5) phase of the cortisol rhythm during the baseline night (∼3 lux; closed circles) and during exposure to bright light (∼10,000 lux; open circles). Open box indicates timing of bright light exposure on the light exposure night. Box filled with diagonal lines indicates timing of dim light on the light exposure night; however, in reality dim light subjects were continuously exposed to dim light for the entire scheduled wakefulness episode. Note that the last time point shown for the light exposure session is an average of the last 12 min of light exposure and the first 18 min of dim light exposure. * denotes significant differences in cortisol levels between baseline and light exposure nights (p < 0.024; modified Bonferroni correction). Error bars represent SEM.

