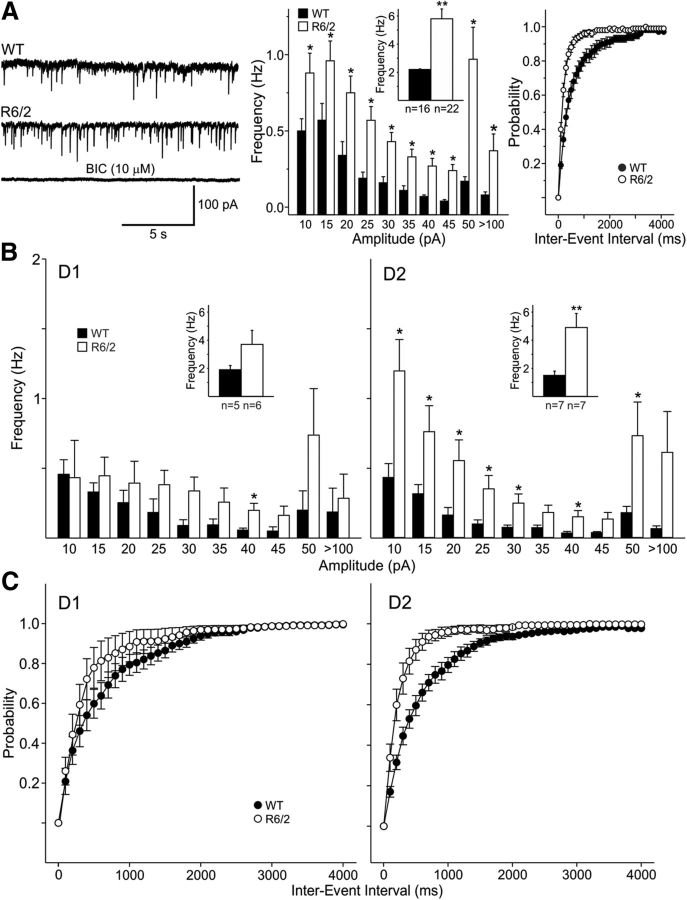
Figure 1.
A, Traces show sIPSCs from WT and R6/2 MSNs (CsCl internal solution, −70 mV holding potential, CNQX, and AP-5 present). Bottom trace shows that BIC (10 μm) blocked the inward currents demonstrating they were mediated by activation of GABAA receptors. The middle graph shows that amplitude-frequency histograms had significantly increased frequencies of events across all amplitude bins, with the largest increase in the 50–100 pA bin. Inset shows mean frequencies. Right graphs show cumulative interevent interval probability distributions indicating that there was a significant leftward shift in interevent intervals in MSNs from R6/2 mice (proportionately more events with shorter intervals in MSNs) (p < 0.001, K–S test). B, Amplitude-frequency histograms indicate that, although there was a trend, D1-MSNs did not show significantly different frequencies of events in R6/2 mice, except for the 40 pA amplitude bin. In contrast, D2-MSNs in R6/2 mice showed significant increases at all amplitude bins except the largest amplitude bin. C, The cumulative interevent interval probability distributions indicated that there was a significant difference in interevent intervals in D1 (p < 0.05, K–S test) and particularly in D2 MSNs from R6/2 mice (p < 0.001, K–S test). In this and subsequent figures *p < 0.05, **p < 0.01, and ***p < 0.001.

