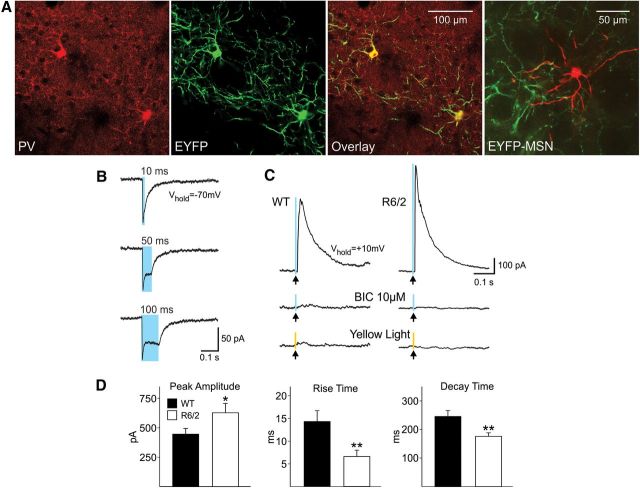
Figure 8.
A, The expression of PV was visualized by colocalization of immunostaining for PV (red) and expression of EYFP fluorescence of ChR2-PV (green) to demonstrate the construct was only expressed in PV interneurons (yellow). The last panel shows a biocytin-filled MSN (red) surrounded by EYFP expression (green) in axons from PV interneurons. B, Inward currents evoked by blue light (0.5 ms duration, 8 mW power) in a PV-positive interneuron. Note that increasing the duration of the light increases the duration of the current. C, Outward currents evoked from MSNs in WT and R6/2 mice in response to blue light stimulation (0.5 ms duration, 8 mW power) at a holding potential of +10 mV. These currents were blocked by BIC (10 μm) and were not evoked by yellow light (0.5 ms duration light pulse, 2mW). D, Bar graphs show significantly increased mean peak amplitude (p < 0.05) and faster rise (p < 0.01) and decay times (p < 0.01) in MSNs from R6/2 compared with those from WT mice.

