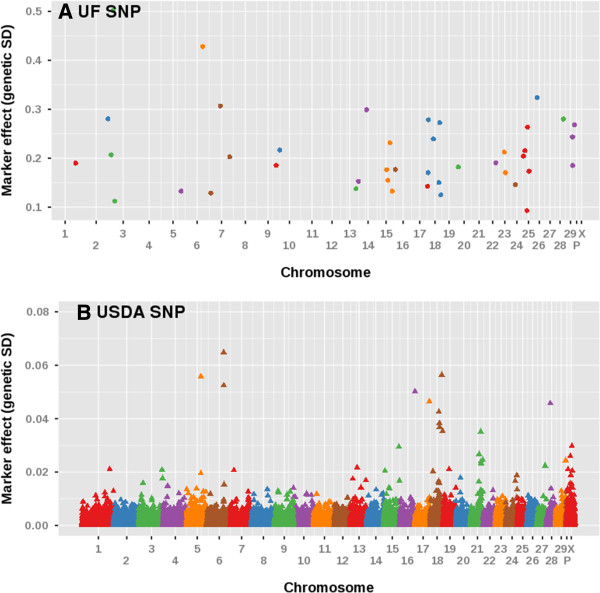
Figure 2.

Manhattan plots comparing SNP effects on daughter pregnancy rate from the current study (panel A; UF SNP) to marker effects from the BovineSNP50 chip in a previous study (panel B; USDA SNP) [[7]]. Each chromosome is represented in a different color along the x-axis. The y-axis is the marker effect on daughter pregnancy rate (genetic standard deviations). The markers are color coordinated according to their chromosome location.
