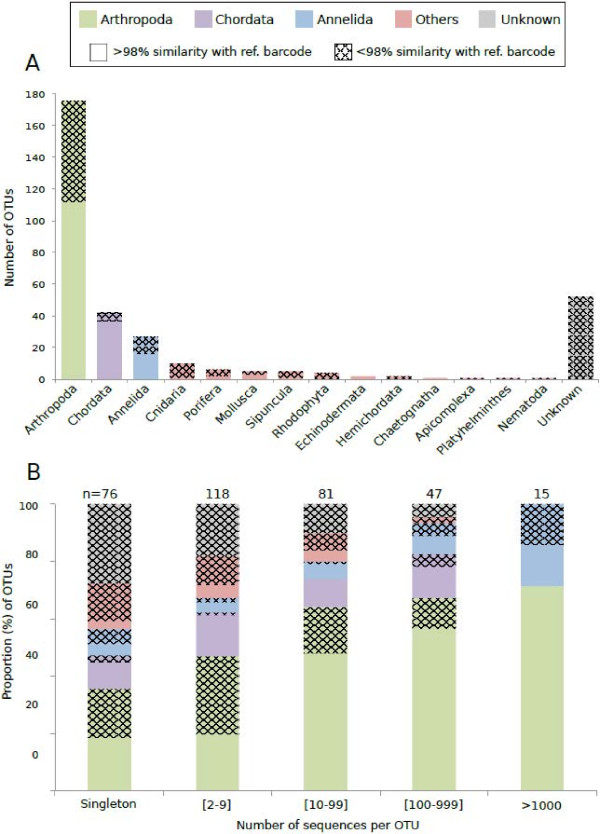
Figure 4.
Diversity, identity and sequence abundance of Operational Taxonomic Units (OTUs) recovered from fish gut contents. A) The number of OTUs per phylum is presented for all fish guts pooled together. OTUs were identified from BLASTn searches performed in the Moorea BIOCODE database and GENBANK. We considered a match to be at the species level when sequence similarity to a reference barcode was >98%. When sequence similarity was < 98%, we used the Bayesian assignment tool implemented in SAP to assign each OTU to a higher taxonomic group, accepting assignments at a significance level of 95% (posterior probability). B) The proportion of OTUs presented per abundance classes. Abundance corresponds to the number of sequences per OTUs.

