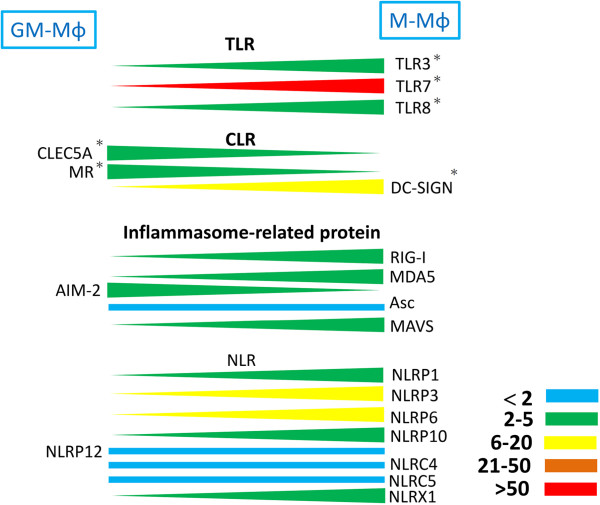
Figure 3.
Relative expression levels of TLRs, CLRs, and inflammasome components between GM-Mϕ and M-Mϕ. Expression levels of these genes are determined by real time PCR and the differential expression levels between GM-Mϕ and M-Mϕ are indicated in color: blue (<2 fold), green (2–5 fold), blue (6–20 fold), brown (21–50 fold), and red (>50 fold). *Indicates the protein expression level for the indicated receptor as confirmed by flow cytometry. TLR, Toll-like receptor; CLR, C-type lectin receptor.

