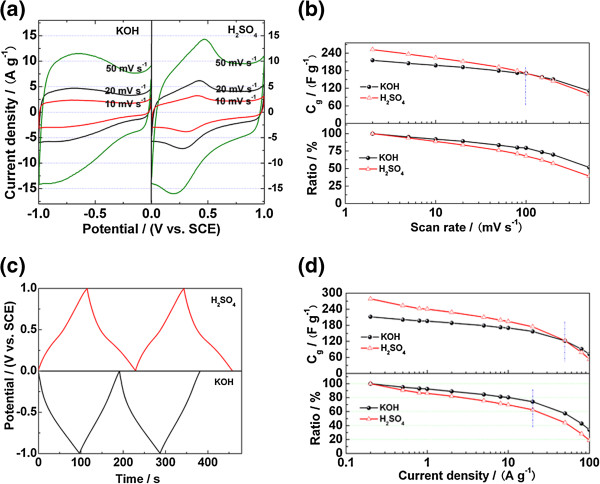
Figure 4.
Electrochemical performance of RGOA in KOH and H2SO4 electrolytes. (a) Cyclic voltammograms at the voltage scan rates of 10, 20, and 50 mV s−1. (b) Plots of specific capacitance and its retention ratio vs. voltage scan rate. (c) Galvanostatic charge–discharge curves at a current density of 2 A g−1. (d) Plots of specific capacitance and its retention ratio vs. current density.

