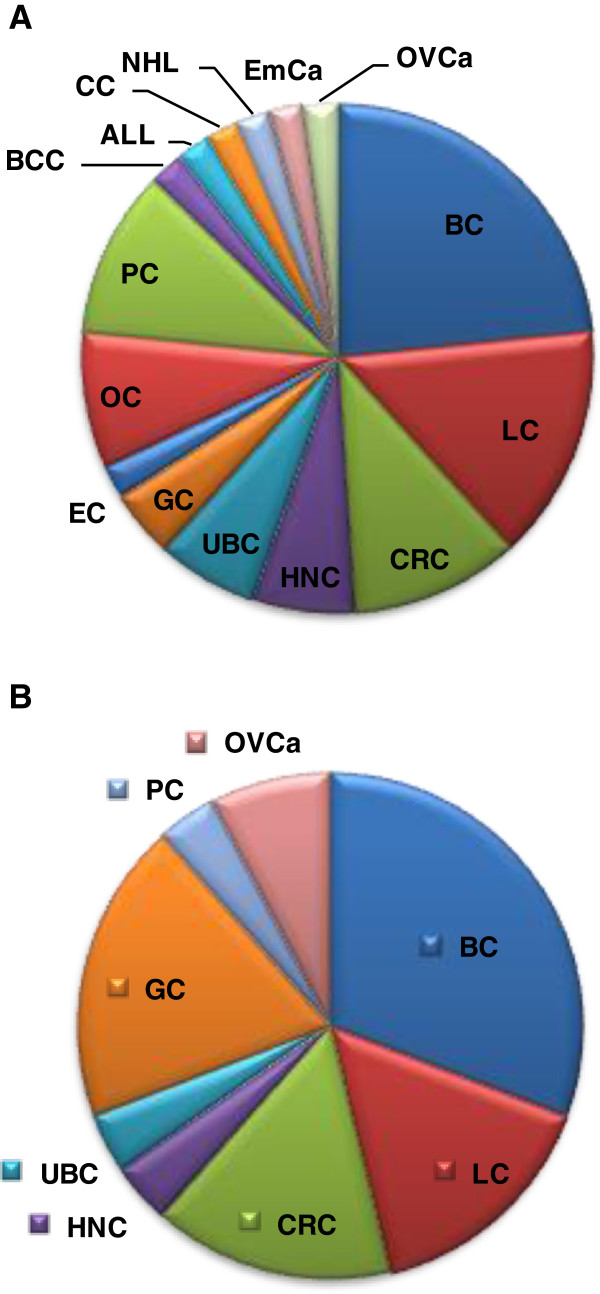
Figure 1.
The distribution of various cancer types. According to (A) the number of SNPs per cancer type and (B) the number of genes or gene correlations per cancer type. By extrapolating the data in Tables 1, 2, 3 and 4, it seems that the number of genome variations and genes is profoundly bigger in BC, probably indicating that this type of cancer is not a single disease but, most likely, a spectrum of related disease states.

