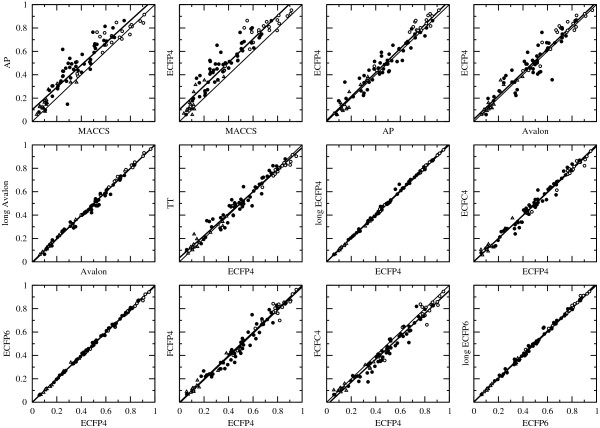
Figure 3.
Correlations between fingerprints. A selection of 12 correlations between 2D fingerprints using the average score of evaluation method BEDROC(20) for the three collection of data sets: MUV (open triangles), DUD (open circles), and ChEMBL (filled circles). The thin line corresponds to y = x while the linear regression curve is shown as a thick, black line.

