
Figure 2.
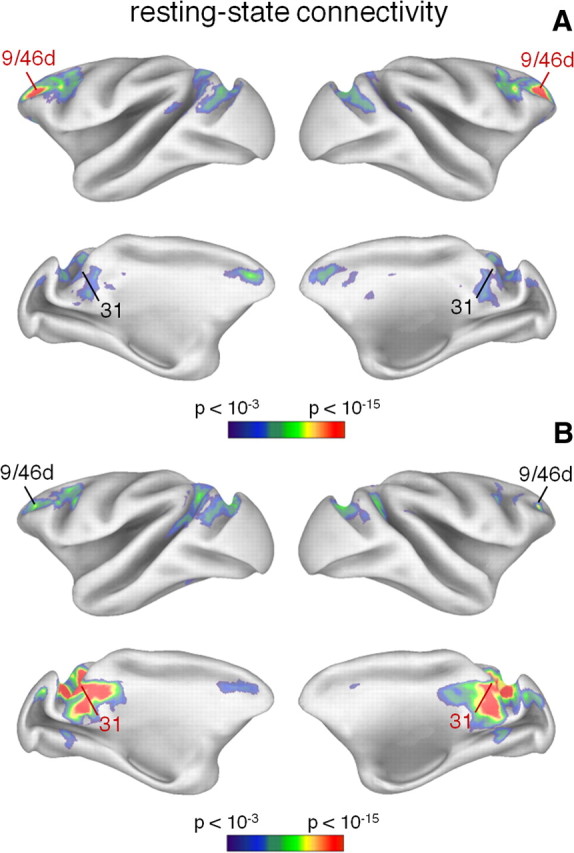
Resting-state functional connectivity maps from monkey areas 9/46d and 31. A, B, Brain regions showing correlated activity with areas 9/46d (A) and 31 (B) are illustrated on an inflated cortex. The seed area is indicated with the red label. Correlation values are shown using a color scale indicating the statistical significance.