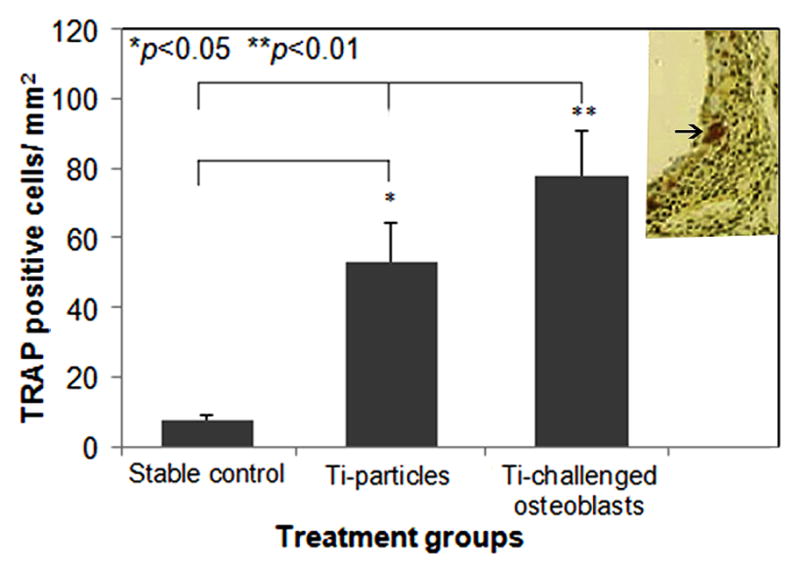
Fig. 6.

TRAP positive cell counts in the sections among groups were determined using a computerized image analysis system with ImagePro+ software (*p<0.05, **p<0.01). The inserted image illustrates a TRAP stained peri-implant tissue section with purple stained osteoclastic cells.
