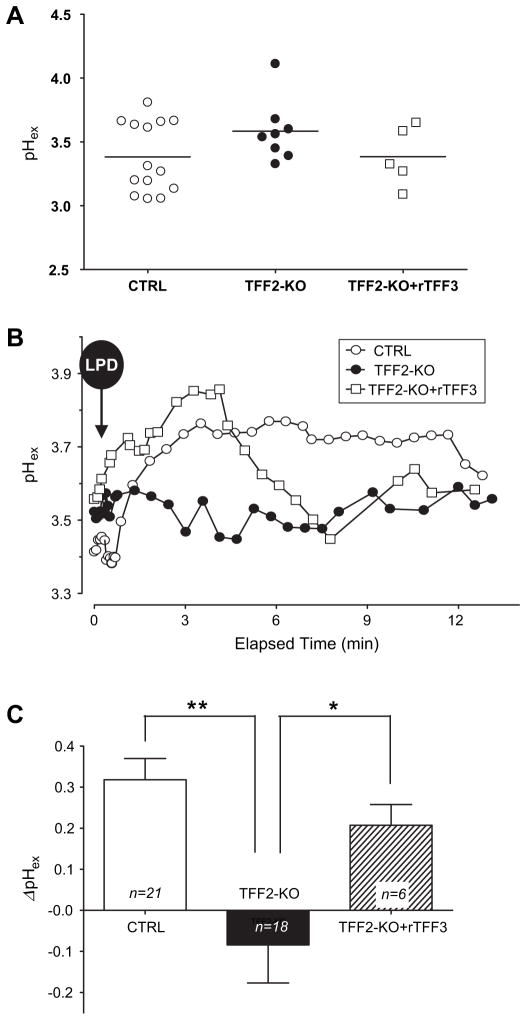
Figure 4.
Gastric epithelial surface pH values from control mice, trefoil factor 2 knockout (TFF2-KO) mice and TFF2-KO mice + recombinant rat TFF3 (rTFF3). As described in the Methods section and figure 1B, extracellular pH was measured adjacent to the gastric surface (pHex) using confocal microscopy of Cl-NERF fluorescence. (A) Resting surface pH collected prior to laser-induced photodamage (LPD). Every pH value is the average value of 6–8 measurements from an individual animal. No significant difference of resting pH among conditions (p=0.87, one-way analysis of variance; SDs were not significantly different). (B) Representative time course of pHex following LPD in control mice (open circles), TFF2-KO mice (filled circles) and TFF2-KO mice after topical application of rTFF3 (open squares). The initial pHex values before LPD were 3.44, 3.52 and 3.61 in control, TFF2-KO and TFF2-KO+rTFF3, respectively. (C) The maximal surface pH change after LPD (ΔpH) was calculated relative to the pre-LPD surface pH in individual experiments, and then values were compiled. The results are presented as the mean±SEM for n experiments. *p<0.05, **p<0.001 in unpaired t test versus values from the TFF2-KO animals.

