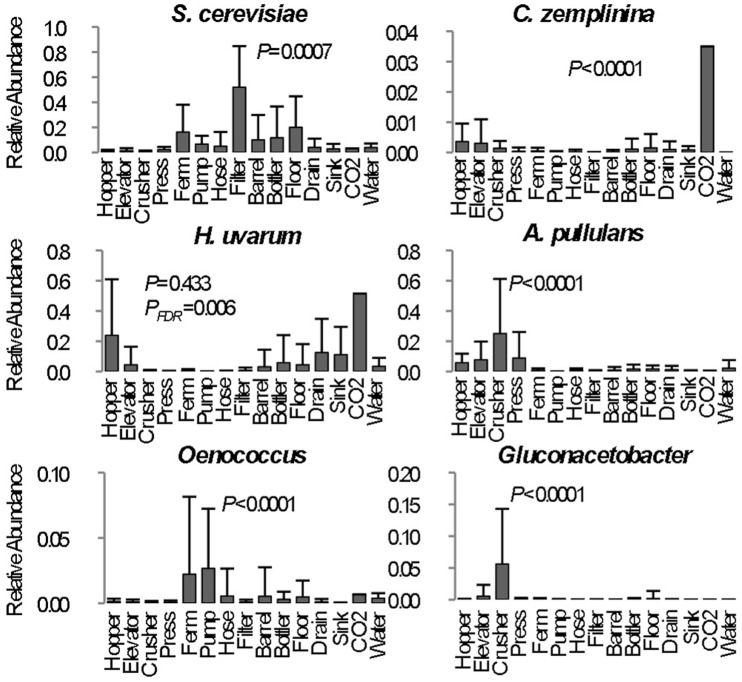
Figure 4. Significant between-category differences in abundance of fermentation-related taxa reflects niche selection within winery surface types.
Each column represents average relative abundance (maximum 1.0) ± SD of select microbial taxa detected in all samples from each category for all three timepoints. One-way ANOVA P values (with Bonferroni error correction) shown for significance between each category. PFDR = false discovery rate-corrected P value; Ferm, fermentor sample mean. Only one sample was collected for CO2 tube category and thus not included in statistical calculations.

