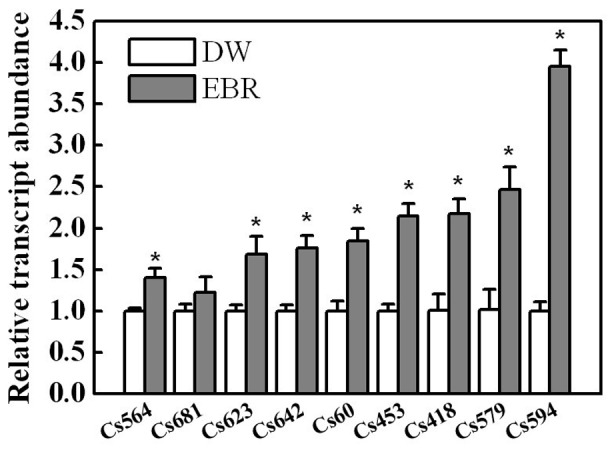
Figure 3. Validation of the up-regulated transcripts present in the SSH library by using RT-qPCR.

Phloem sap was collected from stem cut close to apex and at petioles during various time intervals (3, 6, 9 and 24 h) after foliar EBR treatment. RNA was extracted from the pooled samples and relative mRNA abundances of transcripts obtained from the SSH library were determined by RT-qPCR. The data were obtained from three separate replicates, each value in the graph shows means ± SD. Asterisks (*) indicate a significant difference from the untreated control at P≤0.05 according to Tukey’s test.
