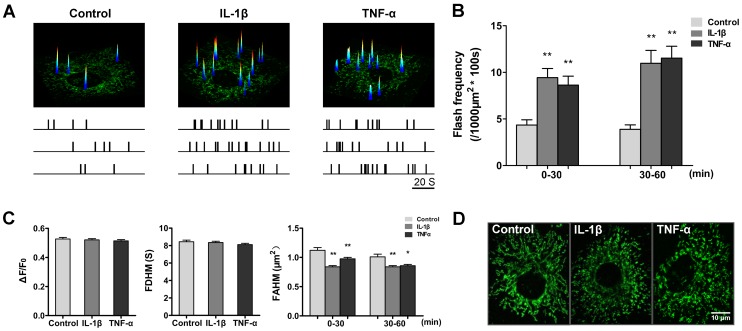
Figure 2. Enhanced superoxide flash activity and mitochondrial fragmentation during IL-1β or TNF-α challenge in cultured chondrocytes.
A, Representative examples showing superoxide flash activities in basal conditions and after IL-1β or TNF-α challenges in different chondrocytes. Data are presented as an overlay of the XY view of a chondrocyte (bottom) and surface plot of all superoxide flashes combined from 100 consecutive frames obtained at 1 frame/s. The lower panel shows temporal diaries of superoxide flash incidence in nine representative cells belonging to three groups respectively, with the uppermost diary corresponding to the image shown. B, Superoxide flash frequency without or during IL-1β (10 ng/ml) or TNF-α (10 ng/ml) challenge. Data are shown as the mean ± SEM values. n = 179–576 events from 42–49 cells for each group. **, p<0.01 versus the corresponding control group. C, Characteristics of spontaneous (control) and cytokine-stimulated (IL-1β or TNF-α) chondrocytes superoxide flashes. ΔF/F0: amplitude. FDHM: full duration at half maximum. FAHM: full area at half maximum. Data represent the mean ± SEM values. n = 42–49 cells for each group. *, p<0.05; **, p<0.01 versus the corresponding control group. D, Representative chondrocyte mitochondrial morphology before (control) and 60 min after IL-1β or TNF-α treatment.

