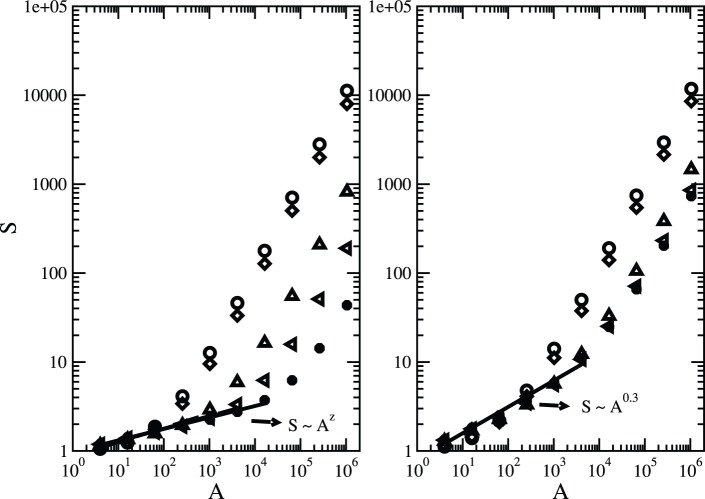
Figure 2. Effect of on biodiversity levels.
Species-area relationships for different values of the Hurst exponent  and fixed fraction of suitable habitats
  . The parameter values are
  ; Hurst exponent:
  (circles),
  (diamonds),
  (triangles up),
  (triangles left) and
  (stars); and speciation rate:
  (left panel) and
  (right panel). The data points represent an average over
  independent runs. The error bars are smaller than the symbols.

