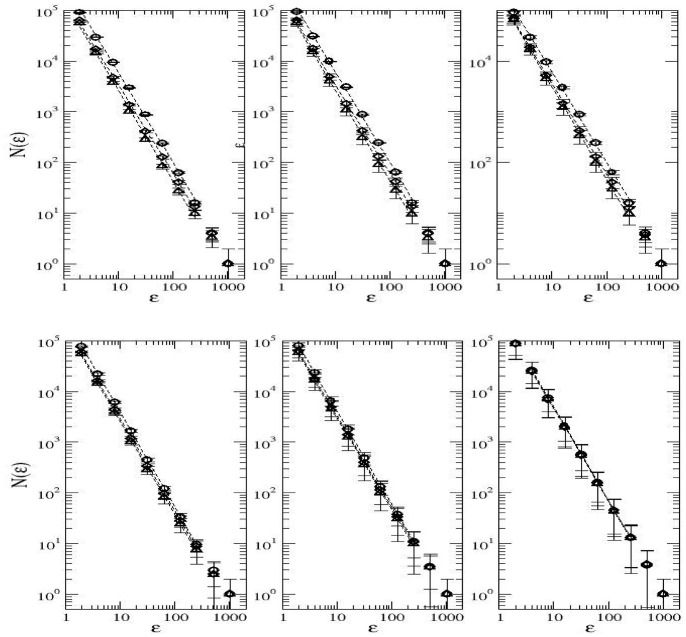
Figure 5. Measurement of the fractal dimension of the spatial distribution of the commonest species.
 versus
  . The parameter values are
  , speciation rates
  (left panels),
  (middle panels),
  (right panels). In the upper panels the fraction of suitable habitats is set at
  , whereas in the lower panels
  . The symbols denote different values of
  :
:  (circles),
  (diamonds) and
  (triangles). The data points represent an average over
  independent runs. The error bars correspond to one standard error.

