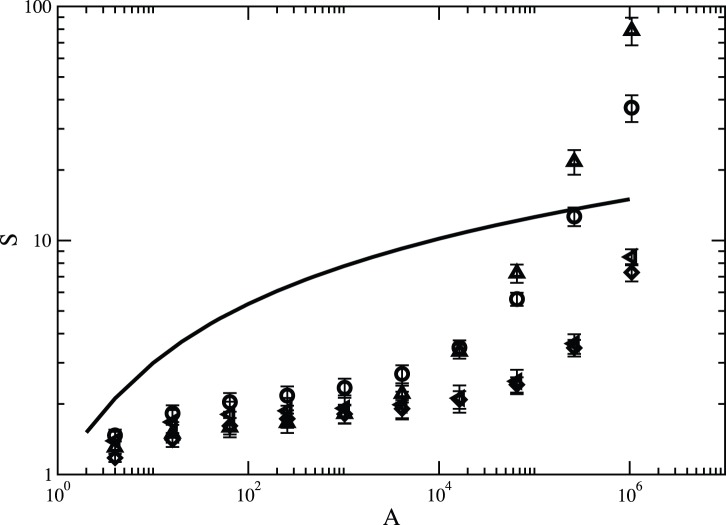
Figure 7. Species-area curves for different values of dispersal parameter.
Number of species  is plotted against area for
  and speciation rate
  . The symbols denote diferrent set of parameter values :
  and
and  (circles),
  and
and  (triangles up),
  and
and  (diamonds),
  and
and  (left triangles). The line is the theoretical prediction for the species-area curve if dispersal is not limited as given by Eq. (5). The data points represent an average over
  independent runs. The error bars correspond to one standard error.

