
Figure 3.
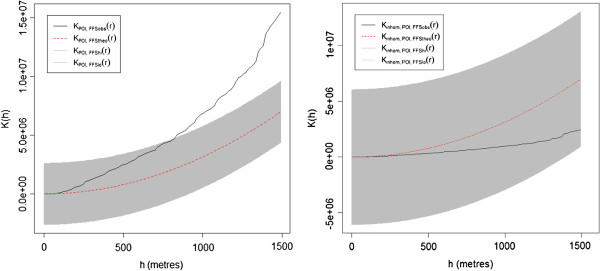
Bivariate K-functions of food retailer around schools. Empirical (black) and expected (red) bivariate K-functions (left: homogeneous, right: inhomogeneous) and 95% global upper and lower confidence limits (grey) showing the clustering of 188 food retailer around 14 schools depending on the distance from schools.