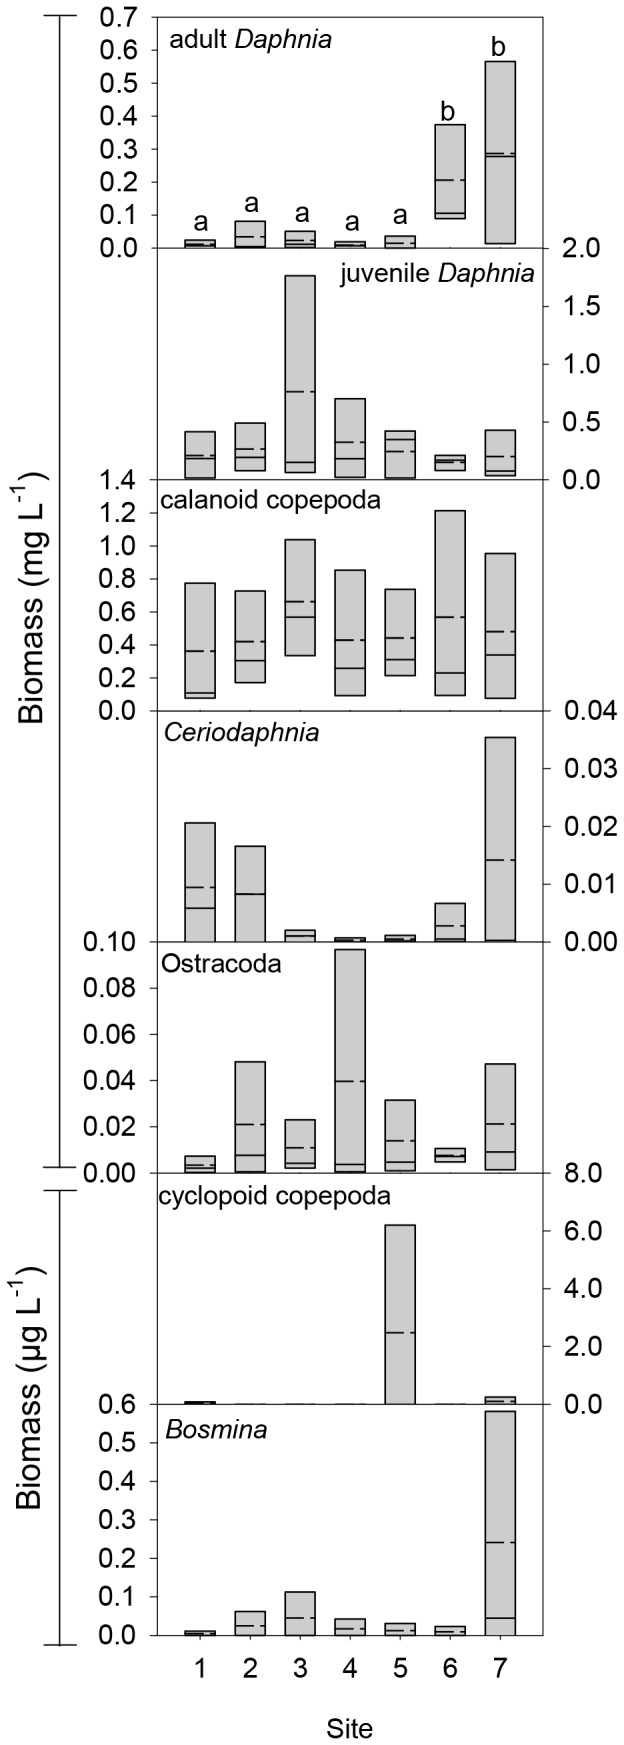
Figure 3. Boxplots for mean biomass of each zooplankton group at each site.

Boxes are the 25th and 75th percentile, solid lines are median and dashed lines are means (N = 5). Boxplots that do not share a common letter are significantly different.

Boxes are the 25th and 75th percentile, solid lines are median and dashed lines are means (N = 5). Boxplots that do not share a common letter are significantly different.