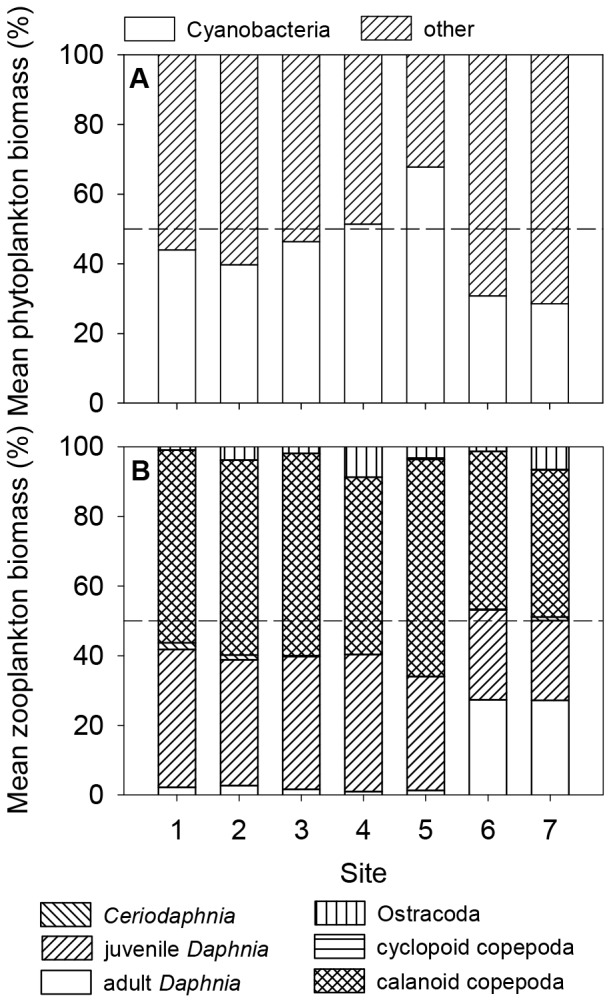
Figure 4. Biomass of phytoplankton and zooplankton groups averaged over time for each site.

Dashed line indicates 50%. Bosmina biomass was omitted as it was <1% at all dates.

Dashed line indicates 50%. Bosmina biomass was omitted as it was <1% at all dates.