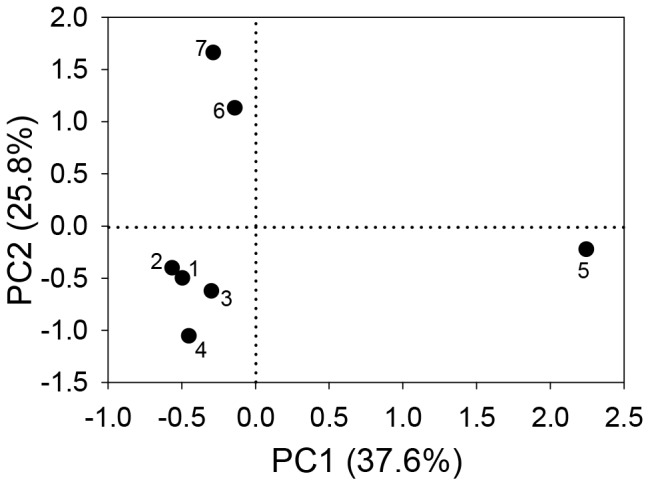
Figure 5. Two-dimensional scatter plot of sampling sites on the two principal components (PC).

Sites are clustered along the x-axis (Factor 1) in site 5 and all other sites and along the y-axis (Factor 2) in sites 6, 7 and 1–5. See text and Table 5 for which parameters represent best each of the factors.
