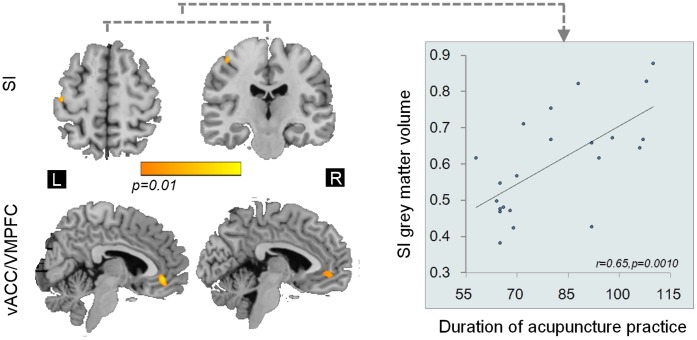
Figure 2. Cerebral VBM differences between groups (p<0.01, corrected) and regression analysis (p<0.05, Bonferroni corrected).
The GMV differences in cerebral regions between groups. Positive linear correlations were found between GMV in the left SI and the duration of acupuncture practice. All images are shown as (1-p) corrected p-value images at the threshold of p<0.01, corrected. The corresponding t values are provided. The vACC/VMPFC was displayed in the sagittal view, and SI in the axial view (on the left side) and the coronal view (on the right side) using MRIcro. vACC/VMPFC: ventral anterior cingulate cortex/ventral medial prefrontal cortex; primary somatosensory cortex: SI.

