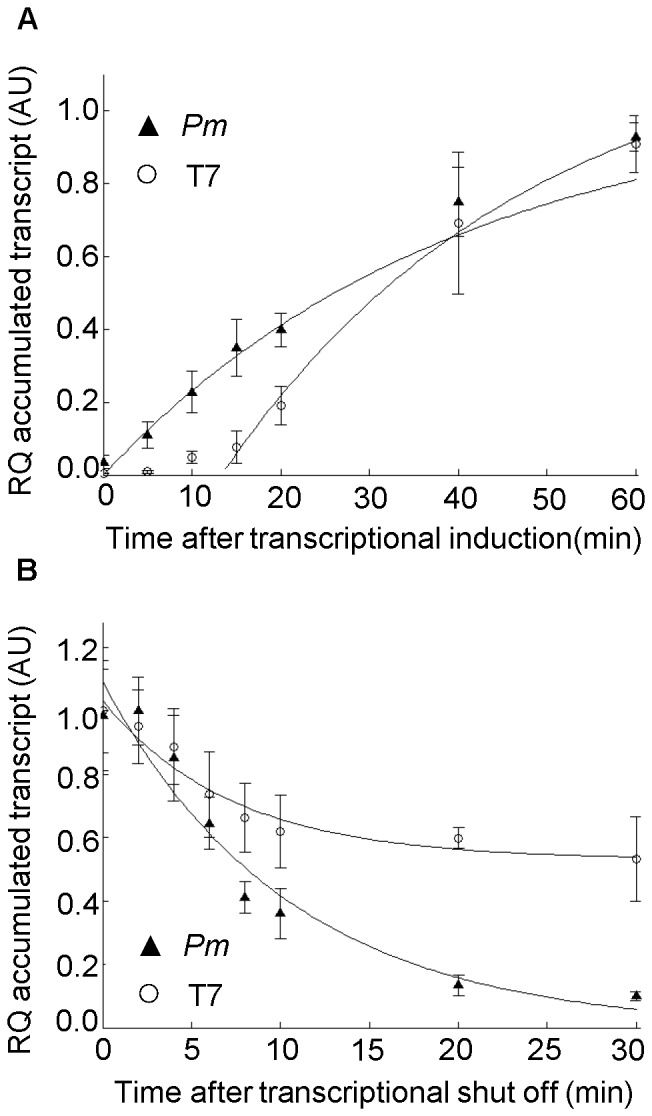
Figure 6. Accumulation and decay of IL1RNS transcripts.

The respective genes were expressed from either the T7 or the Pm promoter. A. For both T7 and Pm promoter generated transcripts the amounts are given relative to the value at time point 60 minutes (arbitrarily set to one). The amounts of IL1RNS transcript generated through the T7 system was increased about 10-fold compared to those of the Pm system (after 60 minutes). Solid lines represent the best fit to the data, calculated according to Eqn 2 (Material and Methods). In case of the T7 system, only time points 15, 20, 40 and 60 minutes were included for the generation of the transcript accumulation curve. B. Parallel determination of decay for Pm and T7 generated transcripts. For both systems all transcript amounts are presented relative to IL1RNS transcript level at time zero (arbitrarily set to one). Error bars show the deviation between three biological recurrences. Solid lines represent the best fit to the data calculated according to Eqn 4 (Material and Methods). RQ: relative quantification, AU: arbitrary units.
