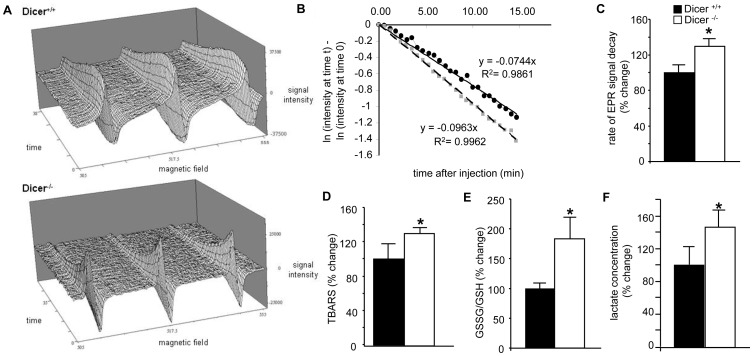
Figure 2. Dicer deletion in the adult heart leads to oxidative stress.
(A) Representative EPR imaging of nitroxide radical decay in (A) Dicer+/+ and (B) Dicer−/− hearts. (B) Time course of average % signal change in the region of interest (ROI). Logarithmic values of signal change (normalized to the initial signal at time = 0) in the ROIs are plotted with respect to time. Decay rate constants were obtained from the slope of linear decay after peak. Line with black circles represent Dicer+/+ and line with grey circles represent Dicer−/−. (C) Bar-graph showing the measured rate constants of nitroxide reduction in the tissues. (D) Thiobarbituric acid–reactive substances (TBARS), an indicator of lipid peroxidation was measured from Dicer+/+ and Dicer−/− hearts and was significantly higher in the later. (E) Total GSSG to GSH ratio in Dicer+/+ mice heart compared to Dicer−/− heart. (F) Lactate levels measured in Dicer+/+ and Dicer−/− mice hearts.

