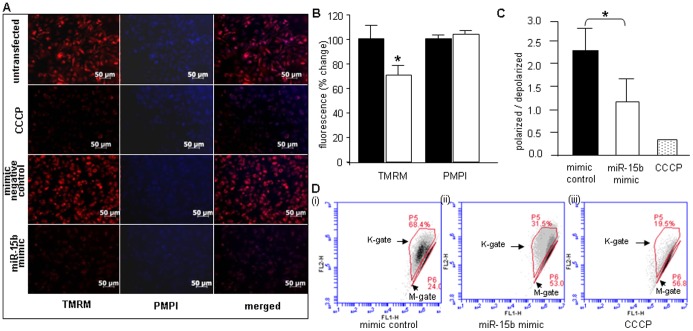
Figure 5. miR-15b over expression in HL-1 cells compromises mitochondrial membrane potential.
(A,B) HL-1 cells were transfected (72 hours) with mimic negative control or miRNA-15b mimic. Untransfected cells were used as negative control and cells transfected with carbonyl cyanide m-chlorophenylhydrazone (CCCP) were used as positive control (left panel –8 nM tetramethylrhodamine methyl ester (TMRM); center panel - 0.5 µl/ml plasma membrane potential indicator (PMPI); right panel - merged image). Bar graph shows significant decrease in TMRM with no change in PMPI. Solid bars represent mimic negative control while open bars represent miRNA-15b mimic. (C,D) Loss of mitochondrial membrane potential in HL-1 cells transfected with miRNA-15b mimic, as assessed by JC-1 flow cytometry 72 h post-transfection. Cells were transfected with a (i) mimic control, (ii) miRNA-15b mimic or (iii) treated with CCCP Arrows (K gate) indicate cells containing JC-1 aggregates resulting from intact mitochondria; M gate indicates cells with low or collapsed mitochondrial membrane potential. Ratio of polarized to depolarized cells calculated as a ratio between cells in K gate to M gate. Data indicate decrease in membrane potential upon up-regulation of miRNA-15b. (n = 3).

