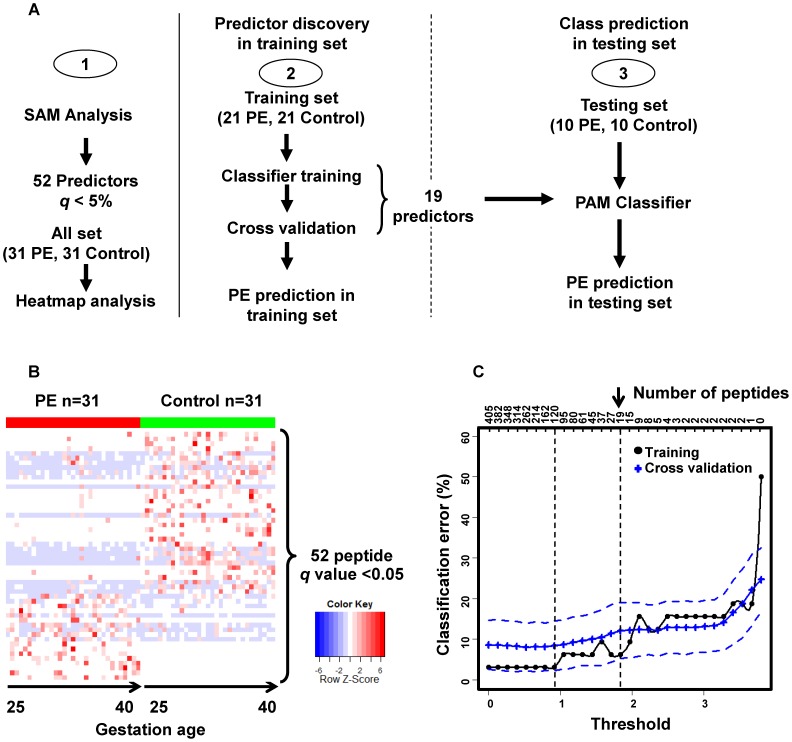
Figure 2. Schematic of the PE serum peptide biomarker discovery and validation.
(A) Study outline. (B) Heatmap display of the differential (SAM algorithm, q<0.05) serum peptide biomarkers. The rows on the heatmap represent the 52 peptides derived from 14 different proteins with each column of that row representing a different sample from subjects with PE (red) and control (green) subjects. Within PE or control groups, the samples are ordered by gestational age from early to late weeks. (C) Predictor panel discovery by PAM was performed with all the peptide identifications found by LC/MS. In training (black line) and cross-validation (blue line), decreasing the threshold (lower x-axis) resulted in an increase in the number of peptides (inserted upper x-axis) that were used for classification and calculation of the classification error (y-axis). The blue dashed lines represent the variance estimate of predicted error. This led to the discovery of a set of 120 peptides with lowest possible classification error and a minimal practical set of 19 peptides (on the right).

